The main basis for starting to trade binary options
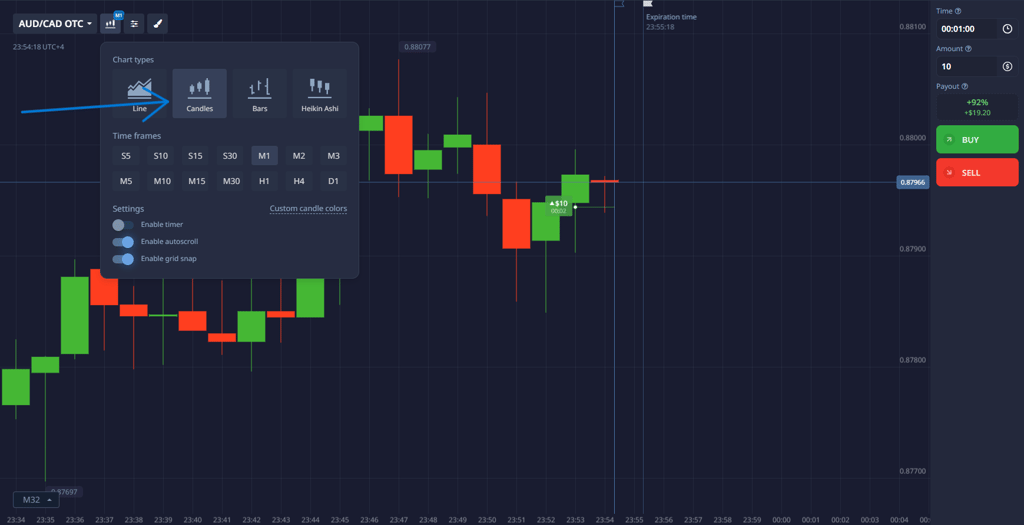
Timeframes for analysis: why M1 and M5 are the optimal choice
For effective market analysis and signal generation, it is recommended to use short-term timeframes M1 (1 minute) and M5 (5 minutes).
Key advantages:
High detail: Provide the clearest and most up-to-date picture of price movements in real time, minimizing market noise typical of longer intervals.
Relevance for intraday trading: Ideally suited to the logic of short-term strategies, allowing you to accurately determine entry and exit points.
Timeliness of signals: Allow you to quickly respond to emerging patterns and changes in momentum, which is critical for trading with short expiries.
Disadvantages of higher timeframes (H1, H4):
Analysis on H1 and higher intervals does not provide signals that are relevant for short-term trades. Such periods have significant inertia and can only be used to determine the global trend, but not to find specific entry points.

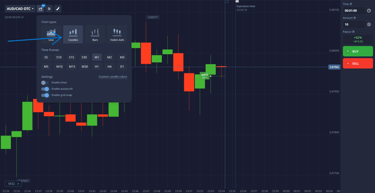
Japanese candlestick analysis: body and shadows
The Japanese candlestick chart is the de facto standard for technical analysis, as it provides the maximum amount of visual information about price behavior over a selected period.
Key elements of a candlestick and their interpretation:
Candlestick body:
Defines the range between the opening and closing prices.
A long green body signals strong buyer dominance (bullish pressure).
A long red body indicates seller dominance (bearish pressure).
A short body (doji) indicates market indecision and a balance of forces.
Shadows (Wicks):
The upper and lower shadows show the recorded price highs and lows for the period.
A long upper shadow with a short body indicates that buyers tried to raise the price but met with strong resistance, and sellers pushed the price down. This is a sign of weakness in an upward movement.
A long lower shadow with a short body, on the contrary, indicates that sellers tried to push the price down but encountered aggressive buying. This is a bullish signal.
Practical application: Combinations of body and shadow lengths form candlestick patterns, which are powerful indicators of a likely reversal or continuation of a trend.
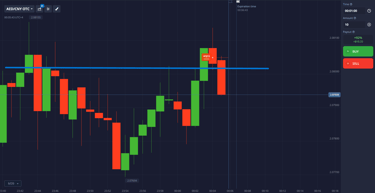
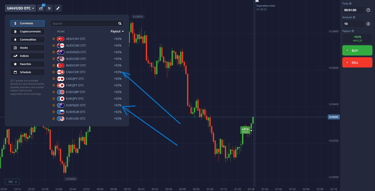
Trading support and resistance levels — your main guide
Before looking for complex indicators or patterns, learn to see the main thing on the chart — support and resistance levels. These are price areas where the strength of buyers (bulls) and sellers (bears) previously converged in battle. These levels become powerful guides for future price movements.
What are support and resistance?
Support is a level below the current price where the strength of buyers was previously strong enough to stop the decline. At this level, you can expect the price to rebound upward.
Resistance is a level above the current price where sellers' strength was previously strong enough to stop the rise. At this level, you can expect the price to rebound downward.
How can this be used in practice?
Prices rarely move chaotically. They often test (“probe”) these important levels. Your task is to wait for the moment when the price once again approaches a significant level of support or resistance and look for confirming signals to enter (for example, reversal candlestick patterns or a rebound from the level).
Pro tip: The strongest signals occur when several different analysis methods point to the same thing. For example, the price approached the resistance level and simultaneously formed a bearish “Bearish Engulfing” pattern. This is a powerful combination.

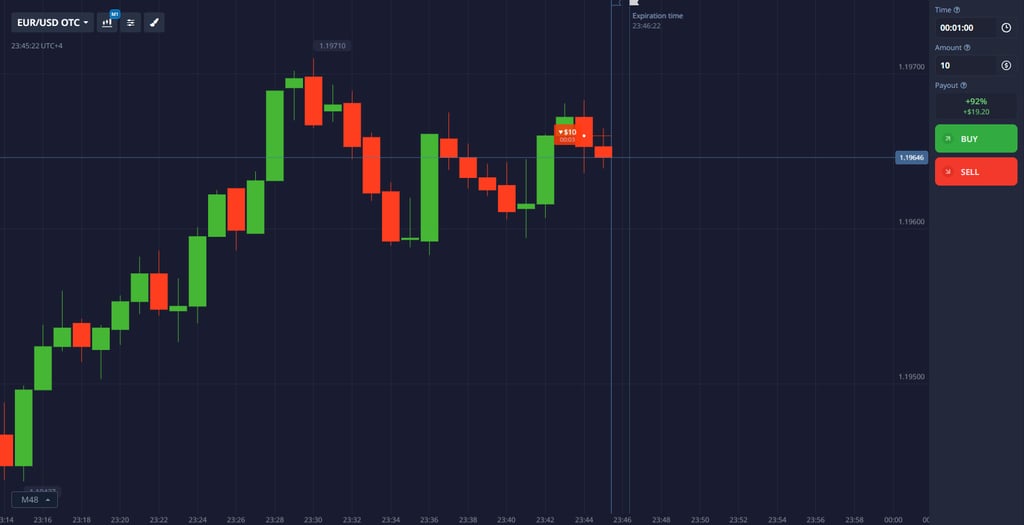
Why is an expiration time of 1-5 minutes the golden mean?
Choosing the expiration time is not just a technical parameter, but a key element of your trading strategy. For trading on the M1 and M5 timeframes, the optimal time for closing trades has been empirically determined to be 1 to 5 minutes.
Why shouldn't you set less than 1 minute?
Trades with expirations of 15, 30, or 45 seconds cease to be analysis and become gambling. Prices move chaotically over such ultra-short intervals and are strongly influenced by market noise rather than a developed signal. The probability of success in this format tends toward 50%, which is equivalent to tossing a coin.
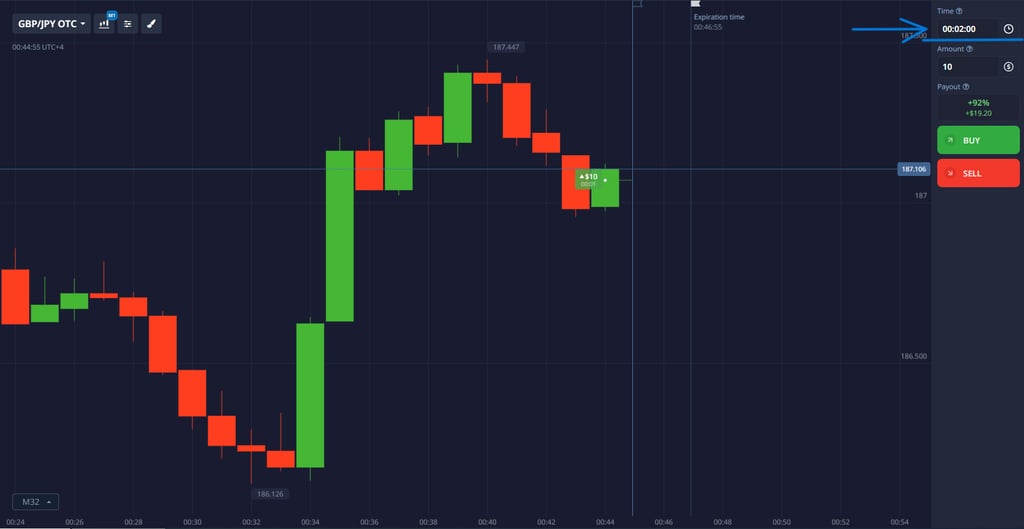
Why shouldn't you set it for more than 5 minutes?
By concluding a deal for 10 or 15 minutes, you significantly increase the risks. During this time, many unforeseen events can occur in the market: news releases, changes in volume, or simply corrective movements that will reverse the price movement, even if the initial analysis was correct. You lose control of the situation.
Ideal: 1-5 minutes
This time interval perfectly matches the logic of price movement after a trading signal is formed on small timeframes. This time is sufficient for the price to work out your idea, but not enough for random and unpredictable factors to interfere with its movement. You trade a specific signal here and now.

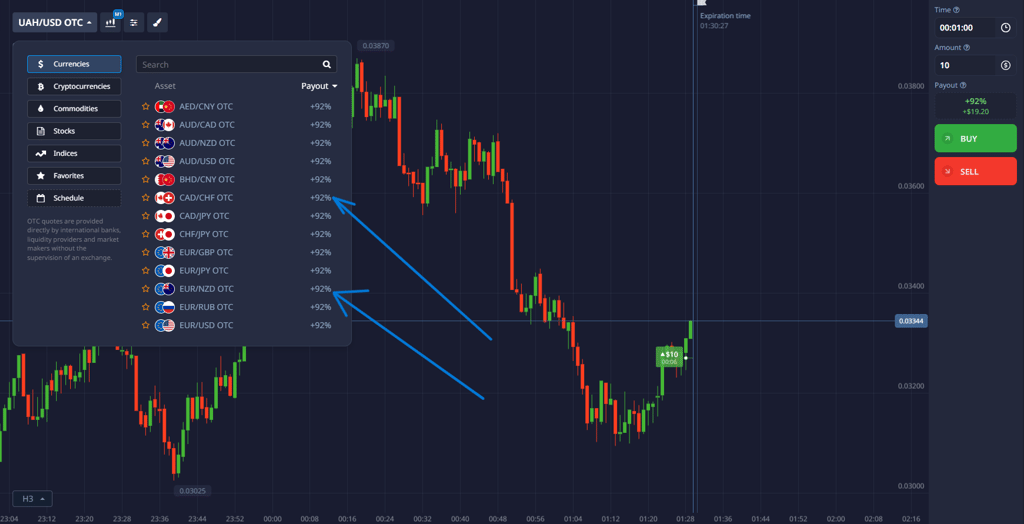
Why it is important to analyze several assets simultaneously
One of the key mistakes novice traders make is focusing on a single chart. While you are looking at only one currency pair, you are missing out on potentially better signals on other assets. Analyzing multiple charts increases your efficiency and reduces risks.
How it works in practice:
Search for the best signal. Signals in the market do not form simultaneously. While the EUR/USD is moving uncertainly, the GBP/USD may already have formed a clear candlestick pattern at a reliable level. By analyzing 3-5 major pairs, you always choose the highest quality and most obvious signal for entry, rather than trading whatever is at hand.
Diversification instead of excitement. If you like to make several trades in a row, doing so on a single asset is extremely dangerous. This leads to emotional decisions and “revenge trading.” It is much better to distribute trades across different assets. For example, one trade on EUR/USD, the next on GBP/JPY. This way, each trade is independent and based on a pure analysis of its chart, rather than a desire to win back losses.
Important rule: It is not recommended to open several trades on the same pair within a short period of time. If you are wrong in your analysis, the price will continue to move against you. Waiting and entering on another asset is a more professional approach.
The quote has frozen: why the lack of movement is your ally
One of the key skills of a successful trader is not only the ability to open trades, but also the understanding of when not to trade. A classic example of such a situation is a period when candlesticks follow one another, practically without forming bodies, and the price literally “stands still.”

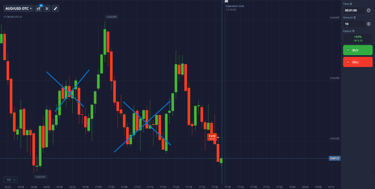
Why is this dangerous for binary options?
Lack of volatility. No movement means no profit. The price does not reach target levels, and expiration often occurs when the quote remains near the entry point.
Impossibility of analysis. Candlestick patterns and indicators give false signals in such conditions. The market is in a state of equilibrium, and it is almost impossible to predict in which direction the breakout will occur.
High risk of a “false breakout.” Any small surge in activity may look like the beginning of a movement, but often it is just “noise” followed by a return to a narrow range.
What to do in such a situation?
Be disciplined. The best thing to do is to refrain from trading.
Wait for a breakout. Watch the chart and wait for the moment when the price confidently breaks through the boundaries of the established “corridor” with an increase in volume.
Trade only after confirmation. Enter the trade not on the breakout itself, but on the subsequent pullback and renewed movement towards the breakout.
Remember: Professionals earn money not on the number of trades, but on their quality. The ability to wait patiently for the best conditions is a sign of an experienced trader.