Candlestick patterns: the language of the market for binary options traders
Candlestick patterns are the universal language of financial markets, allowing you to “hear” the battle between bulls and bears. The ability to read these graphic patterns is a key skill for making timely and accurate decisions in binary options trading. These are not just figures; they are a reflection of crowd psychology frozen on the chart.
What is a candlestick pattern and why does it work?
Each Japanese candlestick tells the story of a single trading period (minute, hour, day). Its body and shadows show who dominated: buyers (bulls) or sellers (bears). When these candles are arranged in specific sequences (patterns), they form powerful signals indicating a high probability of a trend continuation or reversal.
Patterns work because they:
Visualize psychology: They show moments of fear, greed, and indecision.
Determine the balance of power: They clearly indicate which side (bulls or bears) is gaining the upper hand.
Provide specific entry points: They show not only what to do, but also when to do it.
Bullish patterns: signals to buy (Call)
These patterns form after a downward movement and signal an upward price reversal.
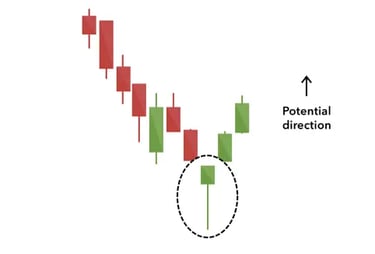
1. Hammer pattern
Appearance: A small body at the top and a very long lower shadow with almost no upper shadow. Resembles a hammer.
Logic: Bears pushed the price down strongly, but bulls were able to find the dip and close the session at the very highs. This is a sign of weakness among sellers.
Action: Call signal after confirmation by the next bullish candle.

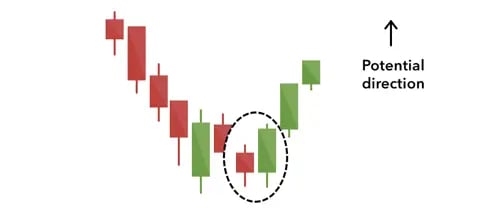
2. Bullish Engulfing Pattern
Appearance: Consists of two candlesticks. A small bearish candlestick is completely “engulfed” by the body of the next large bullish candlestick.
Logic: The bullish candlestick starts below the previous day's lows, but aggressive buying not only stops the decline but also reverses the market with such force that it overtakes the entire previous session.
Action: A strong signal to buy (Call) at the close of the second candlestick.
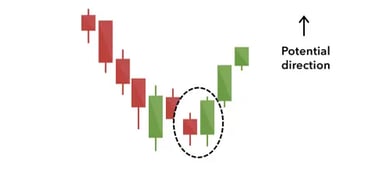
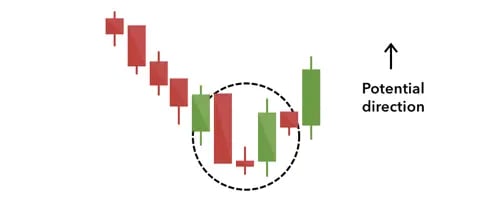
3. Morning Star Pattern
Appearance: Three-candlestick combination. After a long bearish candlestick, a candlestick with a small body (star) appears, indicating indecision, followed by a long bullish candlestick.
Logic: The strength of the downtrend is waning (star), and buyers are taking the initiative.
Action: Call signal after the close of the third bullish candle.

Bearish patterns: signals to sell (Put)
These patterns appear at the peak of an upward movement and warn of an impending decline.
1. Hanging Man pattern
Appearance: Identical to the Hammer pattern, but forms at the end of an upward trend.
Logic: Despite the growth, sellers were able to sharply drop the price during the session. Although the bulls recovered part of the decline, this is a serious warning sign of weakness.
Action: A signal to be cautious and look for a point to sell (Put) after confirmation by the next bearish candlestick.

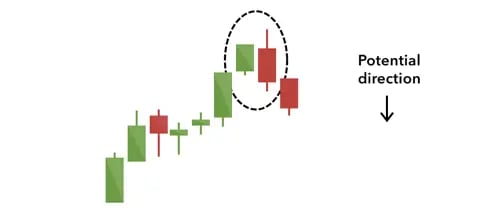
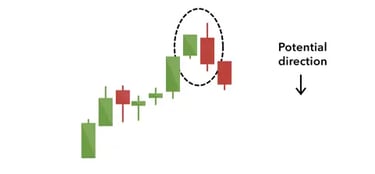
2. Bearish Engulfing Pattern
Appearance: The opposite of bullish. A small bullish candle is completely covered by a large bearish candle.
Logic: Aggressive selling is so strong that it sweeps away all buyers and reverses the trend.
Action: A strong signal to sell (Put).
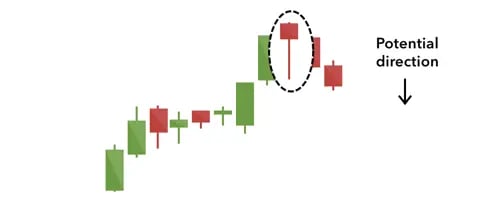
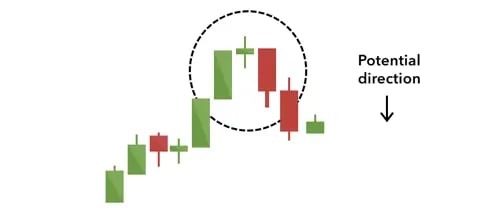
3. Evening Star Pattern
Appearance: A three-candlestick combination, the opposite of the Morning Star. A long bullish candlestick is followed by a star, and then a long bearish candlestick.
Logic: The uptrend is running out of steam, and sellers are beginning to dominate.
Action: Sell signal (Put) after the third candlestick closes.

Trend continuation and indecision patterns
These patterns indicate a temporary pause in the market, after which there is a high probability that the initial movement will continue.
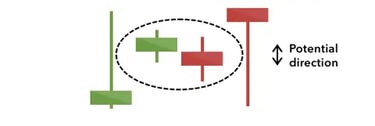
Doji pattern
Appearance: A candlestick with a very small body, where the opening and closing prices are almost equal. It resembles a cross or a plus sign.
Logic: Perfect balance between bulls and bears. The market is indecisive.
Action: By itself, it is not a signal to act. But its appearance at key points (levels) reinforces the significance of the subsequent movement.

How to correctly apply candlestick patterns in trading?
Confirmation — everything: Never trade a pattern until it is fully formed. Wait for the candle that completes it to close.
Combine with levels: Signals that occur at significant support/resistance levels have maximum strength.
Consider the trend context: The Hammer works on a decline, and the Hanging Man works on an increase. Don't confuse them!
Filter with indicators: Use RSI or Stochastic to confirm that the market is not in an overbought/oversold state contrary to the pattern signal.
Important: Candlestick patterns are not a guarantee, but a probability model.