Bears Power and Bulls Power Indicators: A Complete Guide to Trading Binary Options
Bears Power and Bulls Power are paired oscillators created by renowned analyst Alexander Elder to accurately determine the balance of power between bears and bulls in the market. In binary options trading, they are used to find entry points at the very beginning of a strong price impulse. In this guide, you will learn how to read their signals and apply them correctly for trading with expirations ranging from 2 to 5 minutes.

What are Bears Power and Bulls Power?
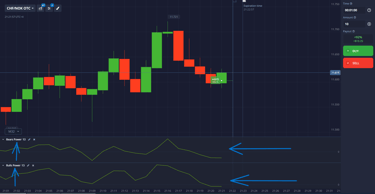
These are two separate but interrelated indicators that are displayed in a single window below the price chart.
Bulls Power measures the strength of buyers (bulls). It is calculated as the difference between the maximum price (High) and the exponential moving average (EMA). A positive value indicates the dominance of bulls.
Bears Power measures the strength of sellers (bears). It is calculated as the difference between the minimum price (Low) and the exponential moving average (EMA). A negative value indicates the dominance of bears.
Key task: Divergence (discrepancy) between indicator readings and price is their strongest signal, warning of an imminent trend reversal.
Setting up indicators in the trading platform
The settings for both indicators are standard and require virtually no changes.
In the indicators menu, find “Bears Power” and add it to the chart.
Then find and add “Bulls Power.” Both oscillators will be displayed in one window.
The recommended period for the exponential moving average (EMA) by default is 13. This parameter is optimal for M1-M5 timeframes.
For clarity, you can assign green to Bulls Power and red to Bears Power.
Signals for Call and Put trades
Signals are generated when indicator lines interact with the zero level and when divergences occur.
1. BUY signal (Call):
Condition: The Bulls Power line (green) crosses the zero line from below and continues to rise. The Bears Power line (red) is in a deep negative zone and begins to turn upward.
Signal amplification: Bears Power is strongly negative but begins to rise, indicating that sellers are running out of steam.
Expiration: 1-5 minutes.
2. Signal to SELL (Put):
Condition: The Bears Power line (red) crosses the zero line from top to bottom and continues to fall. The Bulls Power line (green) is in the positive zone and begins to turn down.
Signal amplification: Bulls Power is strongly positive but begins to fall, indicating buyer exhaustion.
Expiration: 1-5 minutes.
Divergence trading strategy
The most reliable signal from these indicators is classic divergence.
Bullish divergence (Call signal):
The price updates its lows, while the Bears Power indicator forms a higher low.
This means that as the price falls, the strength of the bears weakens. This is likely to be followed by an upward reversal.
Bearish divergence (Put signal):
The price is updating its highs, while the Bulls Power indicator is forming a lower high.
This means that as the price rises, the strength of the bulls is weakening. This is likely to be followed by a downward reversal.
Combining with other instruments
To filter out false signals, always use Bears/Bulls Power in combination with:
Exponential Moving Averages (EMA): Only open trades in the direction of the overall trend. If the price is above EMA(100), look only for buy signals. If it is below, look for sell signals.
Support and resistance levels: Signals received near key levels have the greatest strength and probability of working out.
Awesome Oscillator (AO): Since Bulls/Bears Power is derived from it, using them together gives a clear picture of market momentum.
Conclusion: The Bears Power and Bulls Power indicators are a powerful duo for identifying trend attenuation and finding reversal points. Their key advantage is early warning of momentum shifts. Always wait for clear divergences or a breakout of the zero level and confirm signals on the price chart.