Stochastic Oscillator Indicator: Complete Guide to Trading Binary Options
The Stochastic Oscillator is one of the most popular technical analysis oscillators, developed by George Lane. The indicator measures the position of the current price relative to the price range for previous periods, helping to identify trend reversal points. For binary options traders, Stochastic is an effective tool for identifying moments of market overbought and oversold conditions.

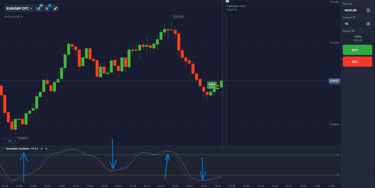
What is the Stochastic Oscillator and how does it work?
The Stochastic Oscillator consists of two lines that show the position of the closing price relative to the price range for the selected period:
%K (fast line): The main line showing the current price position
%D (slow line): The moving average of %K, acting as a signal line
Value range: From 0 to 100 (20 and 80 as key levels)
Calculation formula: %K = (Current price - Min) / (Max - Min) × 100
A distinctive feature of the indicator is its ability to predict trend reversals before they appear on the price chart.
Setting up Stochastic in the trading platform
Recommended settings for binary options:
Period %K: 5-14 (standard - 14)
Slowdown period: 3 (for smoothing %K)
%D period: 3 (signal line)
Levels: 20 (oversold) and 80 (overbought)
Optimal timeframes:
M1-M5: period 5-8
M5-M15: period 10-14
M15-H1: period 14-20
Stochastic trading signals for binary options
1. Intersection of %K and %D lines:
Buy (Call): The %K line crosses %D from bottom to top in the oversold zone
Sell (Put): The %K line crosses %D from top to bottom in the overbought zone
Expiration: 1-5 minutes
2. Exit from overbought/oversold zones:
Buy signal: Exit from the zone below 20 (oversold)
Sell signal: Exit from the zone above 80 (overbought)
Expiration: 2-5 minutes
3. Stochastic divergence with price:
Bullish divergence: Price updates lows, Stochastic shows growth
Bearish divergence: Price updates highs, Stochastic shows decline
Expiration: 3-5 minutes
Practical trading strategy
“Crossing in Zones” Strategy:
Wait for Stochastic to enter the overbought/oversold zone
Wait for the %K and %D lines to cross
Confirm the signal with a candlestick pattern
Enter the trade in the direction of the crossover
Expiration: 1-5 minutes
“Divergence + Level” strategy:
Find divergence between price and Stochastic
Wait for the key support/resistance level to be tested
Enter the trade when the signal is confirmed
Expiration: 2-5 minutes
Combining with other instruments
To increase the effectiveness of Stochastic, use it in combination with:
RSI (14) - to confirm overbought/oversold signals
MACD - to determine the direction of the trend
Moving averages (EMA 20/50) - to filter signals
Support/resistance levels - to accurately determine entry points
Risk management:
Trade size: 1-3% of deposit
Profit/risk ratio: 1:2
Avoid trading in a flat market (Stochastic lines in the middle of the range)
Conclusion
The Stochastic Oscillator is a powerful tool for identifying trend reversals and determining overbought/oversold zones. Its main advantage is its ability to generate accurate signals on short timeframes, which is especially important for binary options traders.