ADX Indicator: A Complete Guide to Determining Trend Strength for Binary Options
The Average Directional Movement Index (ADX) is a unique oscillator developed by legendary trader Welles Wilder to accurately measure trend strength. Unlike most indicators, the ADX does not show the direction of movement, but only determines its intensity. For binary options traders, it is an indispensable tool for filtering market conditions and determining the optimal moments to enter a trade.

What is the ADX indicator and how does it work?
ADX is an oscillator that measures trend strength on a scale from 0 to 100. Key features:
Non-directional: Shows only the strength of the trend without determining its direction
Trend filter: Values above 25 indicate a strong trend
Flat filter: Values below 20 indicate sideways movement
Comprehensive analysis: Works in conjunction with +DI and -DI lines
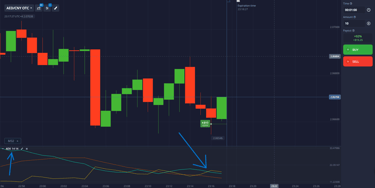
The indicator consists of three lines:
ADX (usually blue) - the main indicator of trend strength
+DI (green) - indicator of upward direction
-DI (red) - indicator of downward direction
Configuring ADX in the trading platform
Optimal parameters for binary options:
ADX period: 14 (standard)
Levels: 20 and 40 to determine trend strength
Color settings:
ADX: blue
+DI: green
-DI: red
Recommended timeframes:
M1-M15 for medium-term trends
M15-H1 for long-term trends
ADX trading signals for binary options
1. Determining trend strength:
0-20: Weak trend or flat - avoid trend strategies
20-40: Strong trend - optimal conditions for trading
40-100: Very strong trend - possibility of continued movement
2. DI line crossover:
Buy signal: +DI crosses -DI from below when ADX > 20
Sell signal: -DI crosses +DI from below when ADX > 20
Expiration: 1-5 minutes
3. ADX divergence:
Bearish divergence: Price rises while ADX falls
Bullish divergence: Price falls while ADX rises
Expiration: 2-5 minutes
Practical trading strategy
Trend Momentum Strategy:
Wait for the ADX to rise above 25
Determine the direction based on the intersection of the DI lines
Wait for a pullback to the moving average
Enter the trade in the direction of the trend
Expiration: 2-5 minutes
Flat Breakout Strategy:
Wait for the ADX to fall below 20
Mark the boundaries of the range
When the ADX rises above 20, enter the breakout
Expiration: 1-5 minutes
Combining with other instruments
To increase the effectiveness of ADX, use it in combination with:
Moving averages (EMA 20/50) - to determine the direction of the trend
RSI (14) - to filter overbought/oversold conditions
Support/resistance levels - to accurately determine entry points
Candlestick patterns - to confirm reversal signals
Risk management:
Trade size: no more than 2% of the deposit
Trade only when ADX > 20
Profit/risk ratio: 1:2
Maximum daily risk: 5%
Conclusion
ADX is a powerful tool for determining trend strength and filtering market conditions. Its main advantage is its ability to distinguish between trending and flat movements, which is especially important for binary options traders. Proper use of ADX in combination with other technical analysis tools can significantly improve entry accuracy and overall trading efficiency.