Support and resistance levels: the basis of technical analysis
Understanding and competently constructing support and resistance levels is a fundamental skill that separates novice traders from professionals. These are not just lines on a chart, but a reflection of market psychology, showing where the interests of major players are concentrated.
What are support and resistance?
Support is a price range where the buying pressure (bulls) is strong enough to stop the price from falling further. At this level, demand is higher than supply. You can think of it as a “floor” that the price bounces off.
Resistance is a price area where the strength of sellers (bears) is strong enough to stop the price from rising. Here, supply exceeds demand. This level acts as a “ceiling” for the price.
Key principle: After a breakout, the support level often becomes resistance, and vice versa. This is because traders who opened positions at these levels begin to act differently.
Practical example: market in a narrow range
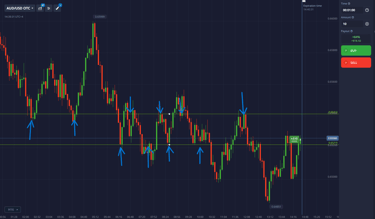
Let's consider the actual market situation using the AUD/USD chart as an example. We can observe that the price has been moving within a very narrow horizontal corridor for an extended period of time, repeatedly testing its boundaries.

Analysis of the situation on the chart:
Clear range boundaries: The price has formed a clear resistance level (upper boundary) and support level (lower boundary). The quote has “bounced” off these lines several times, confirming their significance.
No trend: This movement is called “flat” or “consolidation.” The market is in a state of uncertainty and is gathering strength for the next strong movement (breakout).
Sign of accumulation: Such narrow ranges often indicate that large players (“smart money”) are actively accumulating positions before a decisive breakout.
Why is this important for binary options traders?
Trading at such a moment is associated with high risk. While the price is within the channel, it is extremely difficult to predict its next movement. Indicator signals may be false. The safest and most effective approach is to wait for a confident breakout of one of the boundaries and conclude trades in the direction of the breakout after retesting the level.
How to build and use levels correctly?
Look for points of contact: The more times the price has touched the level and bounced off it, the stronger and more reliable it is.
Combine into zones: A level is not a perfectly thin line, but rather a price zone. Small “tails” of candles beyond the line are normal.
Use higher timeframes: Levels built on H1 or D1 are much more significant than those visible on M5.
Trade from levels: The highest quality buy signals occur at the support level, and sell signals at the resistance level. Look for reversal candlestick patterns there (e.g., Engulfing or Hammer) for confirmation.
Conclusions and recommendations
Support and resistance levels are your main tool for understanding market structure.
Trading in a narrow range (flat) is risky. Be patient.
The key to profit is trading on the breakout of key levels when the market moves out of equilibrium.
Always combine level analysis with other tools (candlestick patterns, indicators) to get more accurate signals.