CCI Indicator: Complete Guide to Trading Binary Options
The Commodity Channel Index (CCI) is a powerful oscillator developed by Donald Lambert to identify cyclical turning points in the market. Despite its name, the indicator works effectively on any financial instrument, including currency pairs and indices. For binary options traders, CCI is an accurate tool for determining market overbought and oversold conditions, with the ability to identify reversal points early on.
What is the CCI indicator and how does it work?
CCI measures the deviation of the price from its statistical mean. Basic principles of operation:
Data normalization: The indicator uses standard deviation to adapt to volatility
Cyclical analysis: Optimally determines periods of overbought/oversold conditions
Versatility: Works effectively on different timeframes
Calculation formula: CCI = (Typical price - SMA) / (0.015 × Average deviation)
A distinctive feature of the indicator is its ability to generate signals in both trending and flat conditions.
Configuring CCI in the trading platform
Recommended settings for binary options:
Period: 14-20 (default settings)
Levels: +100 (overbought), -100 (oversold)
Additional levels: +200/-200 for strong trends
Color settings:
Main line: blue or orange
Levels: gray or dotted
Optimal timeframes:
M1-M3: period 14
M5-M15: period 20
M30-H1: period 50
CCI trading signals for binary options
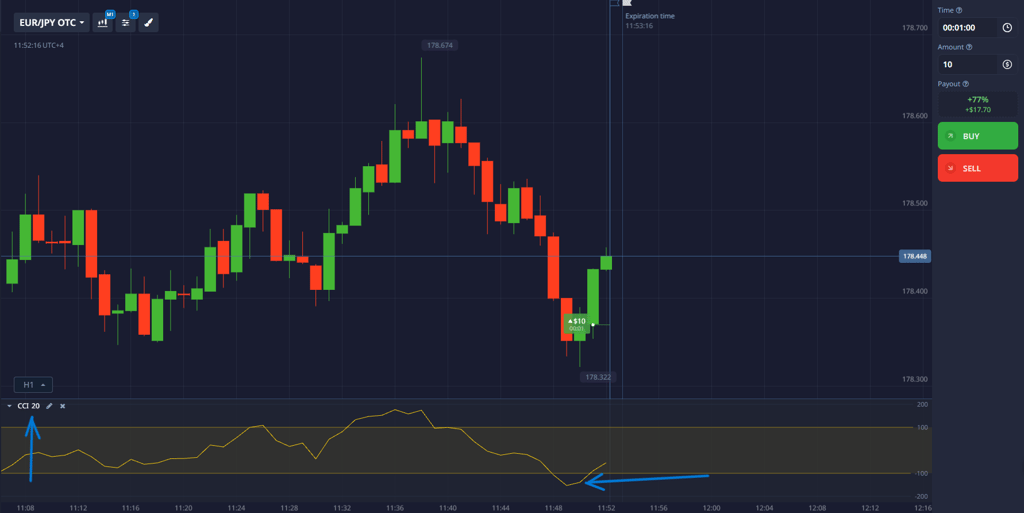
1. Overbought/oversold:
Sell signal: CCI above +100 followed by a downward reversal
Buy signal: CCI below -100 followed by an upward reversal
Expiration: 1-5 minutes
2. Zero line crossover:
Bullish signal: Crossover from bottom to top with growth from -100
Bearish signal: Crossover from top to bottom with a fall from +100
Expiration: 2-5 minutes
3. Divergence:
Bullish divergence: Price updates lows, CCI shows rising lows
Bearish divergence: Price updates highs, CCI shows falling highs
Expiration: 3-5 minutes
Practical trading strategy
Rebound from Levels Strategy:
Wait for the CCI to reach +100 or -100
Wait for the indicator to reverse
Look for confirmation on the price chart
Enter the trade when the extreme is broken
Expiration: 1-5 minutes
Trend Momentum Strategy:
Determine the direction of the trend using moving averages
Wait for a correction to the middle of the CCI range
Enter the trade when there is a rebound in the direction of the trend
Expiration: 2-5 minutes
Combining with other instruments
To increase the effectiveness of CCI, use it in combination with:
Moving averages (EMA 20/50) - to determine the direction of the trend
Support/resistance levels - to accurately determine entry points
Stochastic (5,3,3) - to confirm signals
Candlestick patterns - to determine the entry point
Risk management:
Trade size: no more than 2% of the deposit
Profit/risk ratio: 1:2
Maximum daily risk: 5%
Conclusion
The CCI is a powerful tool for identifying overbought and oversold market conditions. Its main advantage is its ability to generate early signals of possible price reversals.
For binary options, it is particularly effective to use CCI on short timeframes in combination with confirming signals from price action. Proper use of the indicator as part of a comprehensive trading strategy can significantly improve the accuracy of entries and overall trading efficiency.