Momentum Indicator: Complete Guide to Trading Binary Options
Momentum is a classic technical analysis oscillator that measures the rate of price change over a given period. Unlike other indicators, Momentum in histogram format clearly shows the strength of price movement, making it a particularly valuable tool for binary options traders. This guide will reveal effective strategies for using Momentum on short timeframes.
What is the Momentum indicator in histogram format?
Momentum in histogram format visualizes the speed of price movement through columns above and below the zero line. Key features:
Zero line as balance: Columns above zero indicate bullish momentum, below zero indicate bearish momentum
Column height: Reflects the strength of price movement
Calculation formula: Momentum = Current price - Price n periods ago
Visual clarity: Allows you to quickly assess the state of the market
The histogram representation is particularly effective for identifying moments of acceleration and deceleration in a trend.
Setting up Momentum in the trading platform
Recommended settings for binary options:
Period: 10-14 (optimal for M1-M15)
Levels: 0 (base level), +2/-2 (overbought/oversold zones)
Color settings:
Columns above zero: green
Columns below zero: red
Optimal timeframes:
M1-M3: period 8-10
M5-M15: period 12-14
M30-H1: period 20-25
Momentum trading signals for binary options
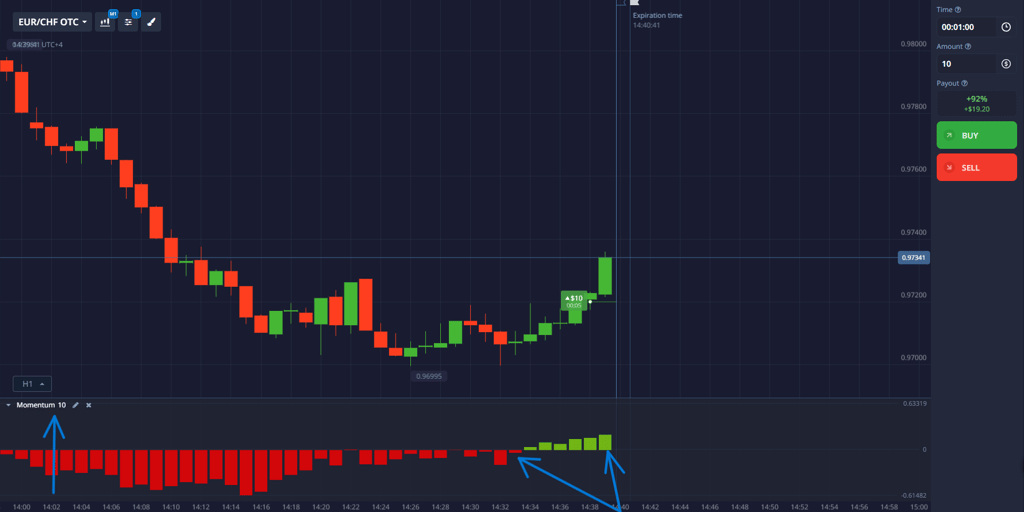
1. Crossing the zero line:
Buy signal: The histogram column crosses 0 from bottom to top
Sell signal: The histogram column crosses 0 from top to bottom
Expiration: 1-5 minutes
2. Divergence with price:
Bullish divergence: Price updates lows, Momentum forms rising lows
Bearish divergence: Price updates highs, Momentum forms falling highs
Expiration: 2-5 minutes
3. Column height analysis:
Momentum strengthening: Increase in column height in the direction of the trend
Momentum weakening: Decrease in column height
Trend reversal: Sharp change in column height and direction
Practical trading strategy
Pulse Breakout Strategy:
Wait for the histogram to clearly cross the zero level
Confirm the signal with an increase in trading volume
Enter the trade when it consolidates above/below zero
Expiration: 1-5 minutes
Divergence Reversal Strategy:
Identify the divergence between the price and the Momentum histogram
Wait for confirmation with a reversal candlestick pattern
Enter the trade in the direction of the divergence
Expiration: 2-5 minutes
Combining with other instruments
To increase the effectiveness of Momentum, use it in combination with:
RSI (14) - to confirm overbought/oversold conditions
Moving averages (EMA 20) - to determine the direction of the trend
Support/resistance levels - to accurately determine entry points
Risk management:
Trade size: 1-3% of deposit
Profit/risk ratio: 1:2
Conclusion
Momentum in histogram format is a powerful tool for measuring the speed of price movement and identifying trend reversal points. Its main advantage is the clear visualization of market momentum through the height and direction of the bars. For binary options traders, the ability to use Momentum on short timeframes in combination with other technical analysis tools is particularly valuable. Correct application of the indicator as part of a comprehensive trading strategy can significantly improve the accuracy of entries and overall trading efficiency.