OsMA Indicator: Complete Guide to Using It for Binary Options
OsMA (Oscillator of Moving Average) is a powerful technical analysis indicator that is an improved version of MACD. This tool combines the advantages of an oscillator and a trend indicator, providing accurate signals for trading binary options. In this guide, you will learn how to correctly interpret OsMA signals and apply them to trading with an expiration of 1-5 minutes.

What is the OsMA indicator and how does it work?
OsMA is the difference between the MACD values and its signal line. The indicator is displayed as a histogram, which allows you to clearly assess the dynamics of momentum changes:
Positive values indicate upward momentum
Negative values indicate downward momentum
A zero value indicates a balance of forces
The main advantage of OsMA is its ability to generate early signals about a change in trend direction.
Configuring OsMA in the trading platform
For optimal indicator performance, use the default settings:
In the indicators menu, select “OsMA”
Default parameters: Fast EMA 12, Slow EMA 26, Signal 9
For greater sensitivity: Fast EMA 6, Slow EMA 13, Signal 5
Customize the color scheme for better visualization
OsMA trading signals for binary options
1. Crossing the zero line:
Call signal: The histogram crosses the zero line from bottom to top
Put signal: The histogram crosses the zero line from top to bottom
Expiration: 1-5 minutes
2. Divergence:
Bullish divergence: The price updates its lows, while OsMA shows an upward movement
Bearish divergence: The price updates its highs, while OsMA shows a downward movement
Expiration: 2-5 minutes
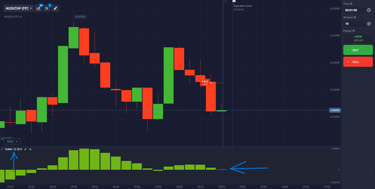
3. Histogram analysis:
Momentum strengthening: Increase in the height of the histogram bars
Momentum weakening: Decrease in the height of the histogram bars
Trend reversal: Change in the direction of the histogram
Practical trading strategy
Pulse Breakout Strategy:
Wait for a clear crossover of the zero line
Confirm the signal with a rise/fall in the histogram
Enter the trade when the signals match
Use an expiration of 2-5 minutes
Combine with support/resistance levels
Features for different timeframes:
M1-M3: Use fast settings (6-13-5)
M5-M15: Standard settings (12-26-9)
M30-H1: Slow settings (21-52-9)
Combining with other instruments
To increase the effectiveness of OsMA, use it in combination with:
Stochastic (14,3,3) - to filter out false signals
RSI (14 periods) - to determine overbought/oversold conditions
Moving averages (EMA 50/100) - to determine the overall trend
Fibonacci levels - to find the best entry points
Risk management:
Trade size: no more than 2-3% of the deposit
Maximum risk per day: 5% of the deposit
Conclusion
OsMA is a powerful tool for analyzing market momentum and identifying entry points in binary options. Its main advantage is its ability to generate early signals of a trend reversal. Proper use of OsMA in combination with other technical analysis tools and strict capital management discipline can significantly improve your trading performance.